KH Kassem Hachem

Case study · Supply Chain · FMCG · Power BI

FMCG Supply Chain
Analytics

A customer-retention investigation connecting fulfillment performance, delivery delays, customer concentration, and contract-renewal risk.

Supply chainPower BIOTIFLiFR / VoFRCustomer risk
29%average OTIF vs 65.9% target
59%on-time fulfillment vs 86.1% target
53%in-full fulfillment vs 76.5% target
70%+late orders for highest-risk accounts
01 · The business question

Why were key customers at risk of not renewing?

Management needed a clear view of whether service failures were caused by product availability, delivery execution, customer concentration, or location-level performance. I shaped the available order data into an interactive Power BI analysis for management discussion.

In plain language:Which customers are most exposed to late or incomplete orders, and what should the supply chain team act on first?
02 · What I analysed
Fulfillment performance

OTIF, On Time, In Full, LiFR, and VoFR by product, customer, city, and time period.

Customer concentration

Order share and target achievement to identify customers whose service problems could have the largest commercial impact.

Delivery execution

Agreed-versus-actual delivery timing to isolate repeated lateness and the size of the delay.

03 · See the work

From performance gap
to account risk.

The visuals were designed to move from the overall supply-chain signal into the customers and delivery patterns behind it.
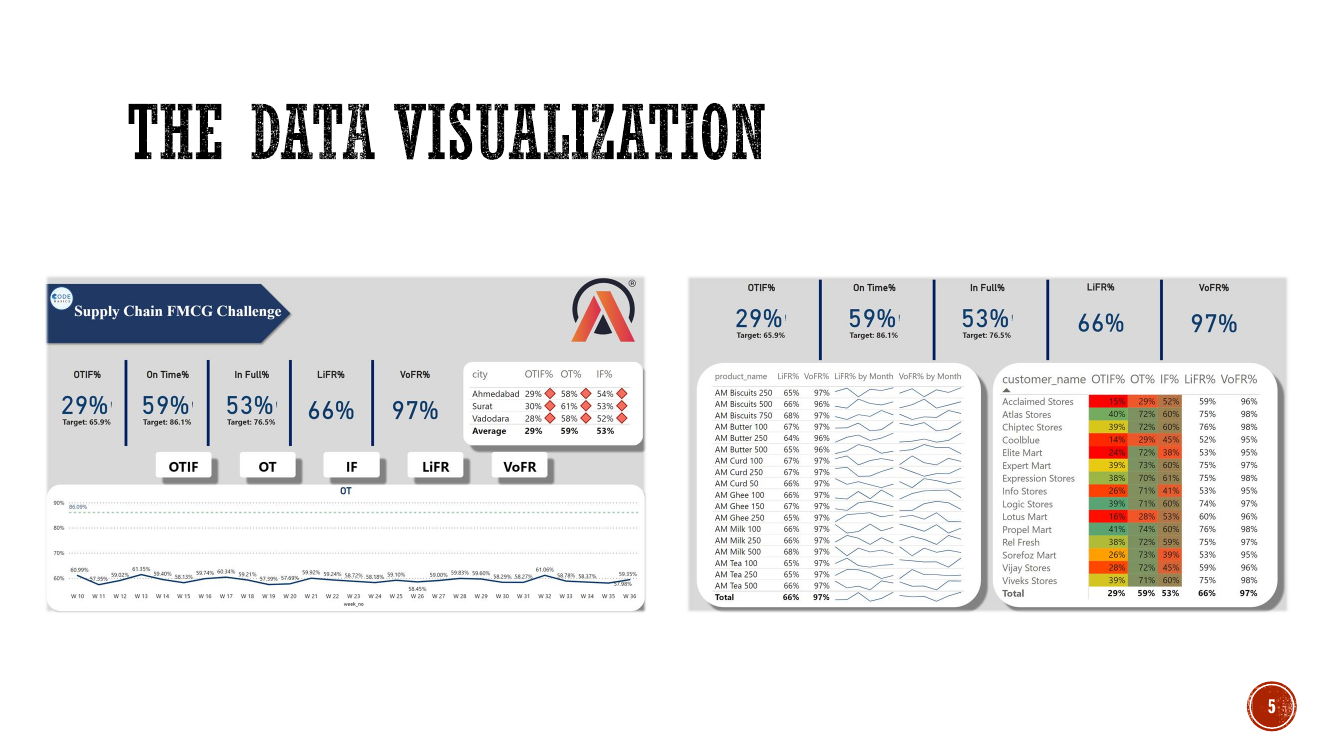
FMCG Power BI dashboard overview
01
Dashboard overviewOTIF, On Time, In Full, LiFR, VoFR, and customer comparison.
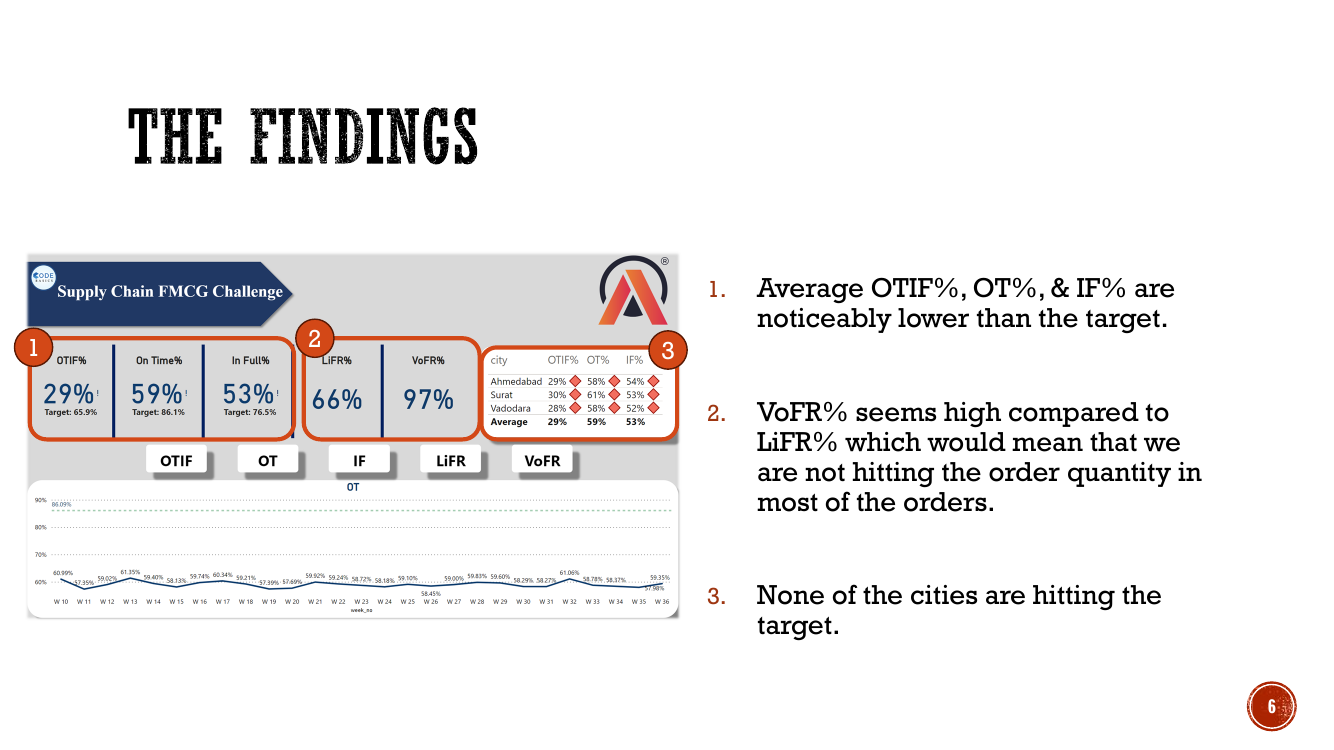
FMCG performance findings
02
Performance findingsTarget gaps across the overall operation, products, and customers.
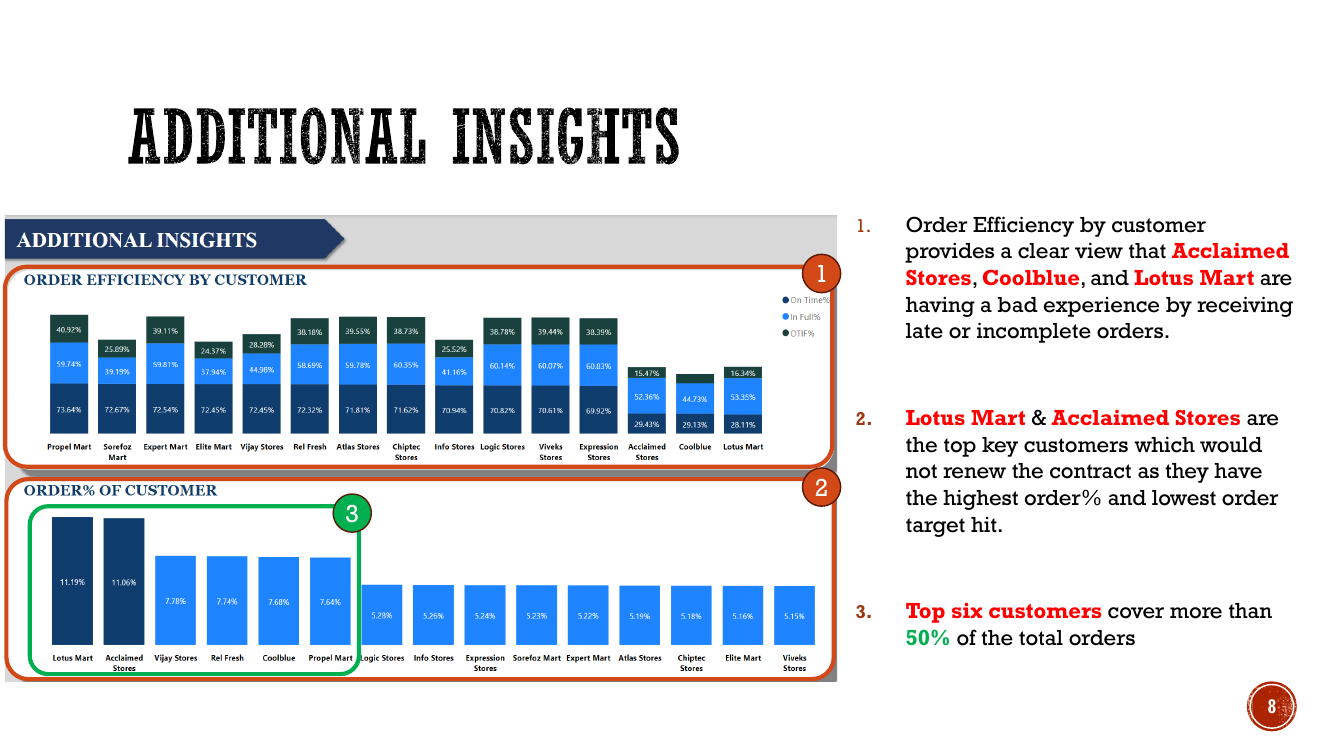
FMCG customer order efficiency and concentration analysis
03
Customer-risk viewOrder efficiency and concentration identify the accounts requiring attention.
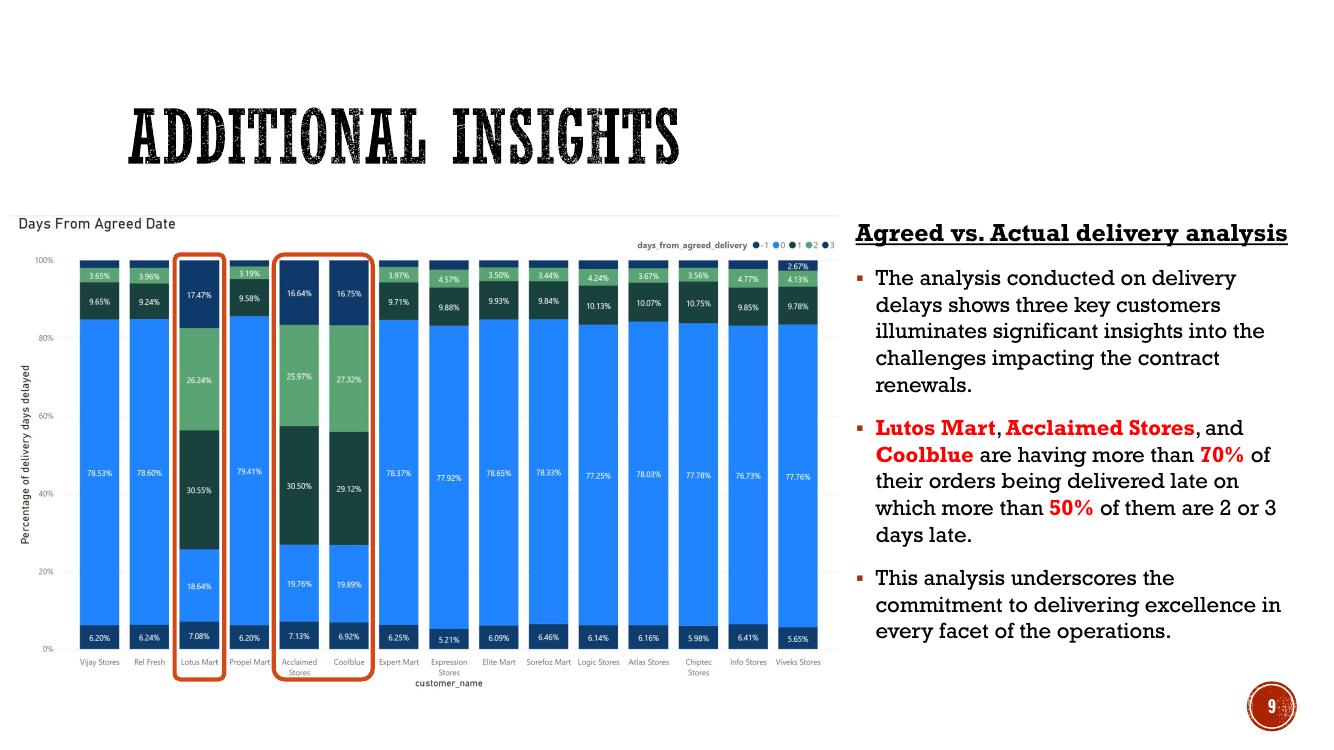
FMCG delivery delay analysis by customer
04
Delivery-delay analysisAgreed versus actual delivery timing for each customer.
04 · What the data says

Service reliability was the renewal risk.

MetricActualTarget
OTIF29%65.9%
On Time59%86.1%
In Full53%76.5%
LiFR66%
VoFR97%
Highest-risk accounts: Lotus Mart, Acclaimed Stores, and Coolblue had more than 70% late orders; more than half of those late orders were two or three days late. The top six customers represented more than 50% of total orders.
05 · Recommendations
Improve demand forecastingRaise In Full and LiFRReview delivery geographyBalance employee workloadAssign key-account ownershipTrack recovery weekly

These actions connect the dashboard findings to supply-chain decisions: improve availability, reduce late delivery, and protect the customer relationships with the greatest commercial exposure.

Open the full project evidence

Review the interactive
Power BI report.

The full PDF documents the case, data, notes, visuals, findings, additional insights, and recommended actions.